Calendar
A monthly heatmap of your trading activity, realized P&L, and upcoming expirations.
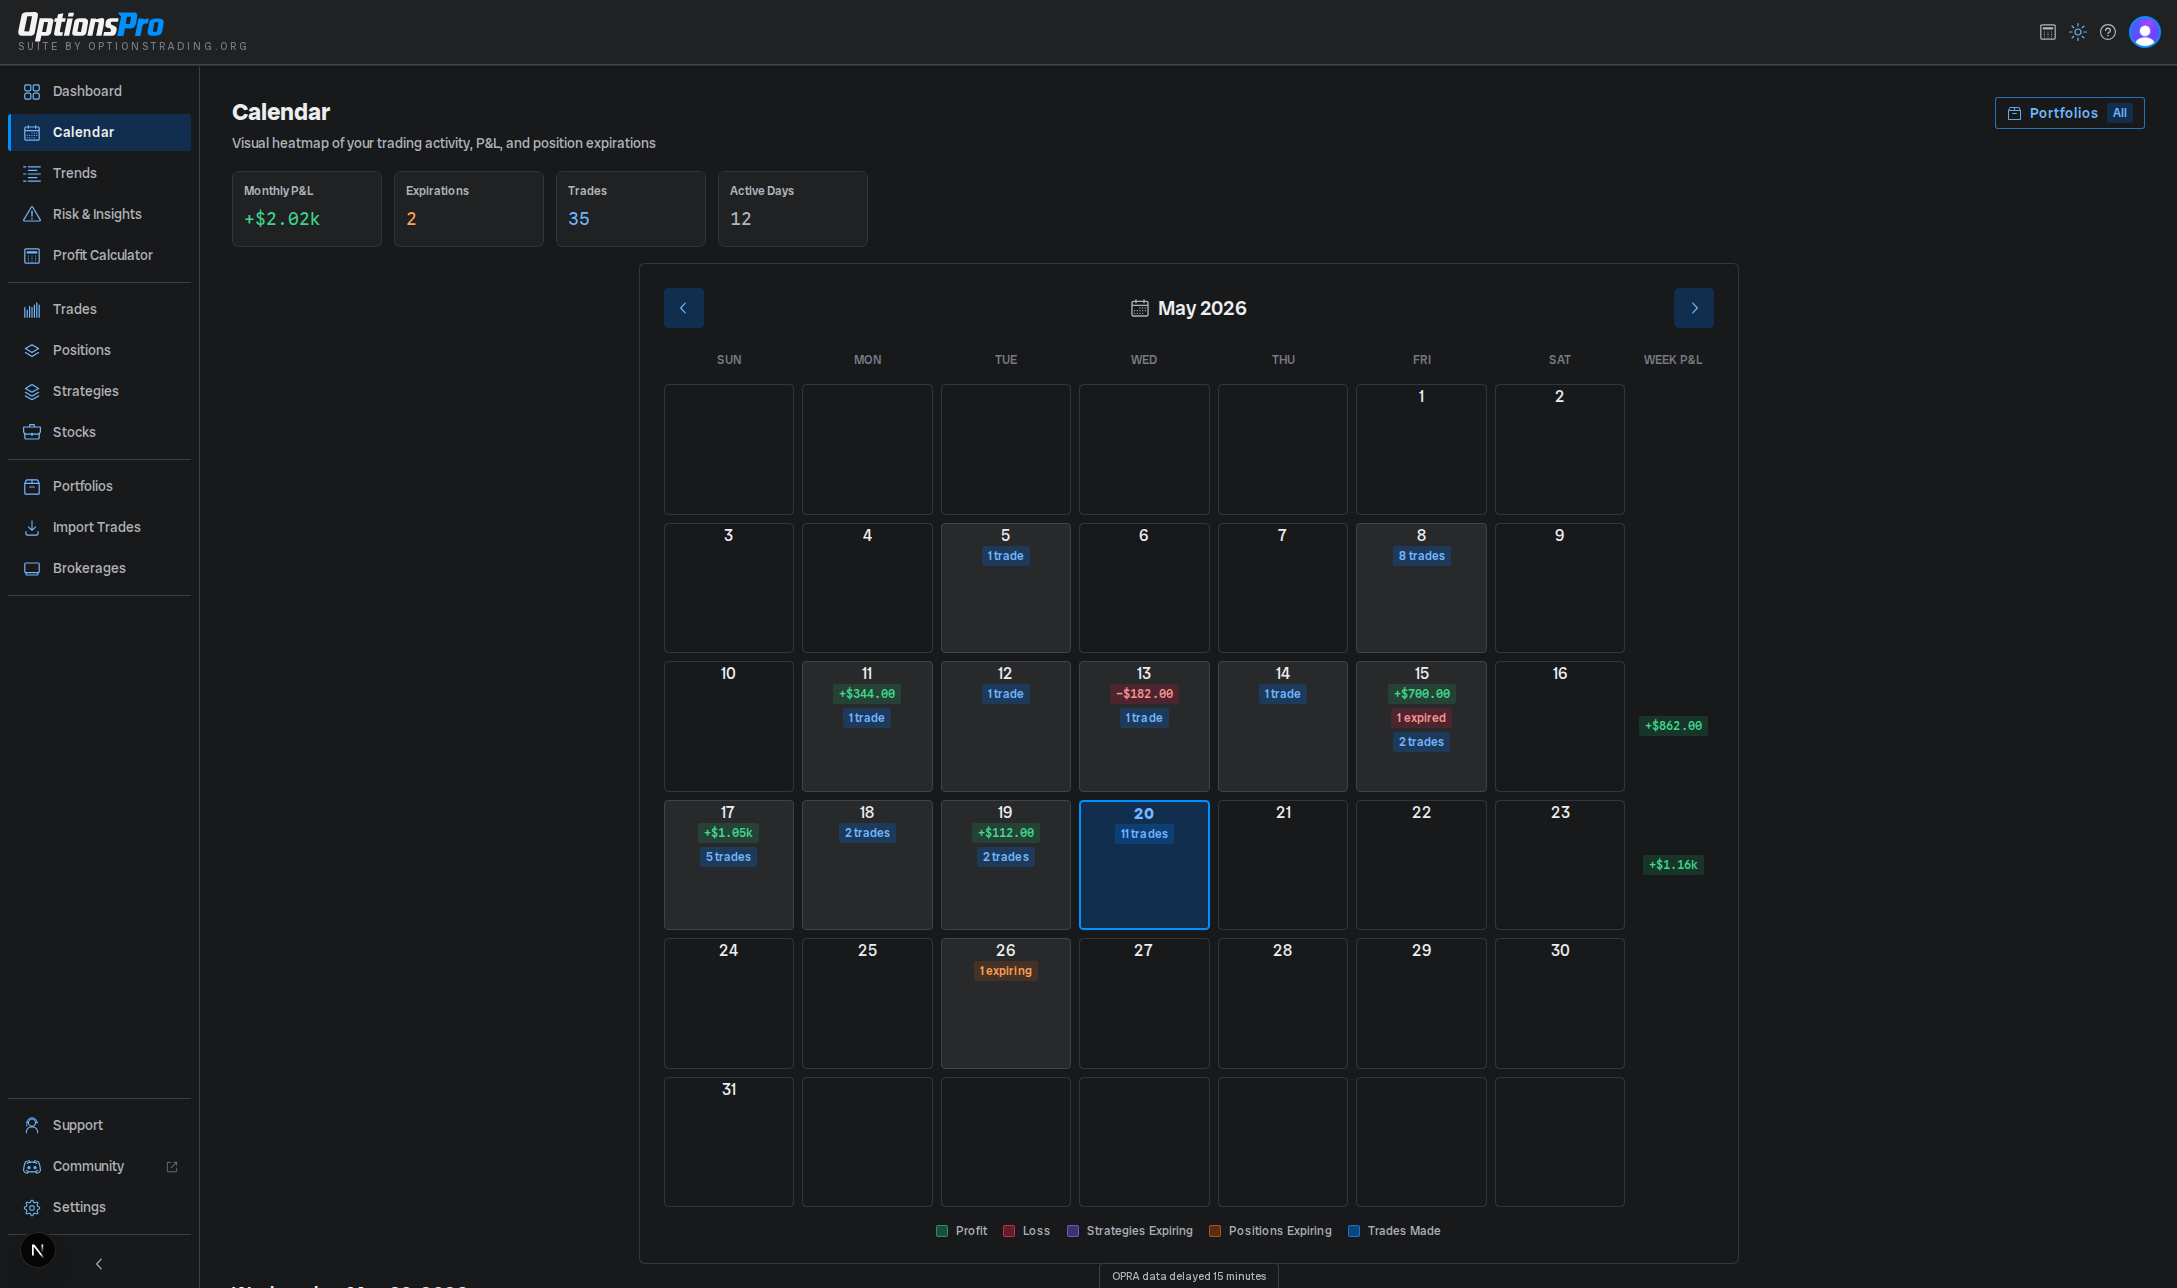
The Calendar is a month-grid view of every day you've traded or have positions expiring. It's the fastest way to see what's coming due, what already settled, and where the active days have been.
N DTE Manage is being rolled out gradually and isn't enabled for every organization yet. If you don't see it on your calendar, it isn't available for your account.
Summary cards
Above the grid, a row of summary cards rolls up the visible month:
- Monthly P&L - total realized P&L across the month, green or red.
- Strategies - count of active strategies expiring this month (only shown when there are any).
- Expirations - total option positions expiring this month, counting both open positions and positions that expired worthless. Positions closed by a BTC/STC trade are not counted here.
- N DTE Manage - total open positions whose management date falls in
this month (only shown when there are any;
Nis your configured management offset, set in Settings, defaulting to 21). - Trades - count of executed trades this month.
- Active Days - number of days with any P&L, expiration, or trade activity.
A portfolio filter sits in the page header to scope all of these (and the grid) to a specific portfolio.
Reading a day cell
Each day cell can show, stacked top-to-bottom:
- A P&L badge with the day's realized P&L (green when positive, red when negative).
- A count of strategies expiring that day (violet for upcoming, purple for past).
- A count of expirations falling on that day (orange for upcoming, red for past). On today the badge reads "expires today".
- A count of N DTE management dates (amber) - open positions reaching
the configured management offset (default 21 days) before expiration on
that day. The tastytrade methodology suggests actively managing
short-premium trades at 21 DTE (take profit, roll out, or close) to avoid
the gamma tail risk that ramps up inside that window. The offset is a
per-user preference set in Settings (default
21). - A count of trades executed that day (blue).
Today gets a thin accent border; the selected day gets a thicker accent border and tinted background. A small color legend sits below the grid. Today is selected by default when you open the page.
Navigating
Use the previous/next arrows in the calendar header to step between months. Navigation is bounded: you can go back as far as your earliest recorded trade, and forward as far as your furthest open expiration (or the end of the current month, whichever is later).
A per-week WEEK P&L column on the right totals realized P&L for that week. Days from the previous or next month that spill into the visible grid still contribute their P&L to the weekly total even though the cells render empty.
Drilling into a day
Click a day to render inline tables below the calendar (still on the same page, not a side panel):
- Daily Closing Equity by Account - end-of-day closing equity and that day's P&L, broken out per brokerage account.
- Strategies Expiring - active strategies whose earliest leg expires on that day. Only appears when there are matching strategies.
- Positions to Manage (N DTE) - open positions whose configured
management date is this day. Only appears when there are matching
positions. Computed as
expirationDate − N daysfor each open option position, using your management offset from Settings (defaults to 21). - Positions Expiring - every option position expiring on that day. Excludes positions you already closed with a BTC/STC trade; includes positions that expired (the table title and badge flip to "Expired" or "Expires Today" based on the date).
- Trades Made - every trade executed on that day.
Each Positions row, and each Trades row that maps to a tracked position, exposes a View Position action via the row's actions menu, which opens the position details modal.
What feeds the calendar
The calendar reads from the same trades, computed positions, and active strategies as the rest of the app. Positions with no expiration (e.g. long stock from an assignment) don't appear here, and a position that's been closed by a BTC/STC trade is not shown as expiring on its original expiration date.
On phones the grid stays a day-by-day layout, just more compact, with colored dots in place of the desktop badges. Drilling into a day works the same way as on desktop.
Dashboard
The dashboard is your trading command center - realized and unrealized P&L, win rate, equity curve, and the latest trades all on one page.
Trades
Every options execution - opens, closes, and expirations - from your connected brokerages and manual entries. Sortable, filterable, and the entry point for fee overrides, manual entry, and trade-by-trade analysis.