Positions
Your currently held contracts, with unrealized and realized P&L, plus Greeks for any open leg.
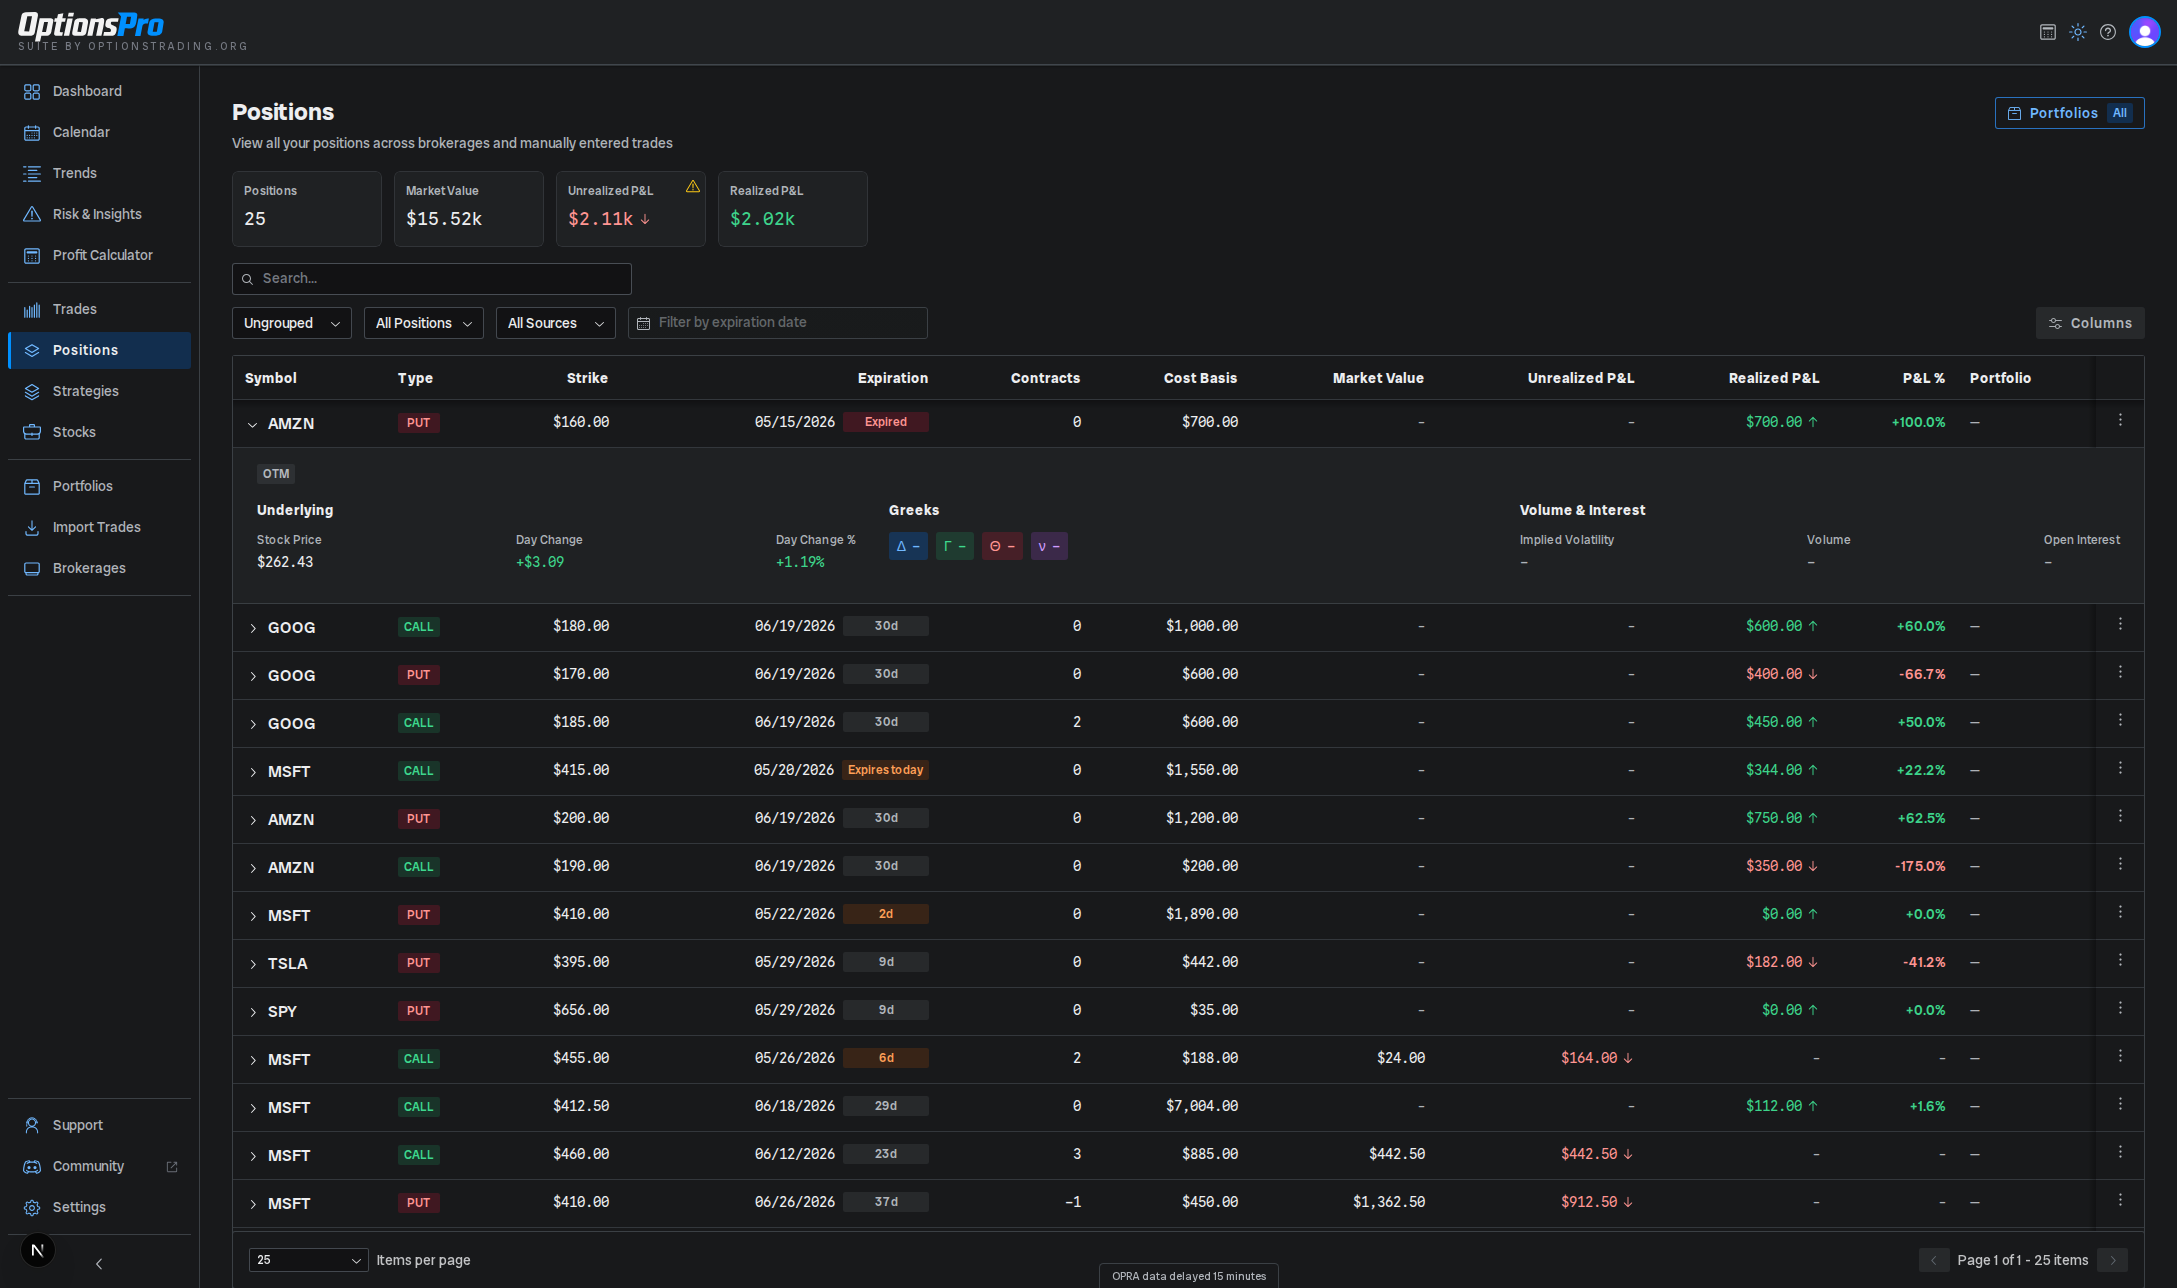
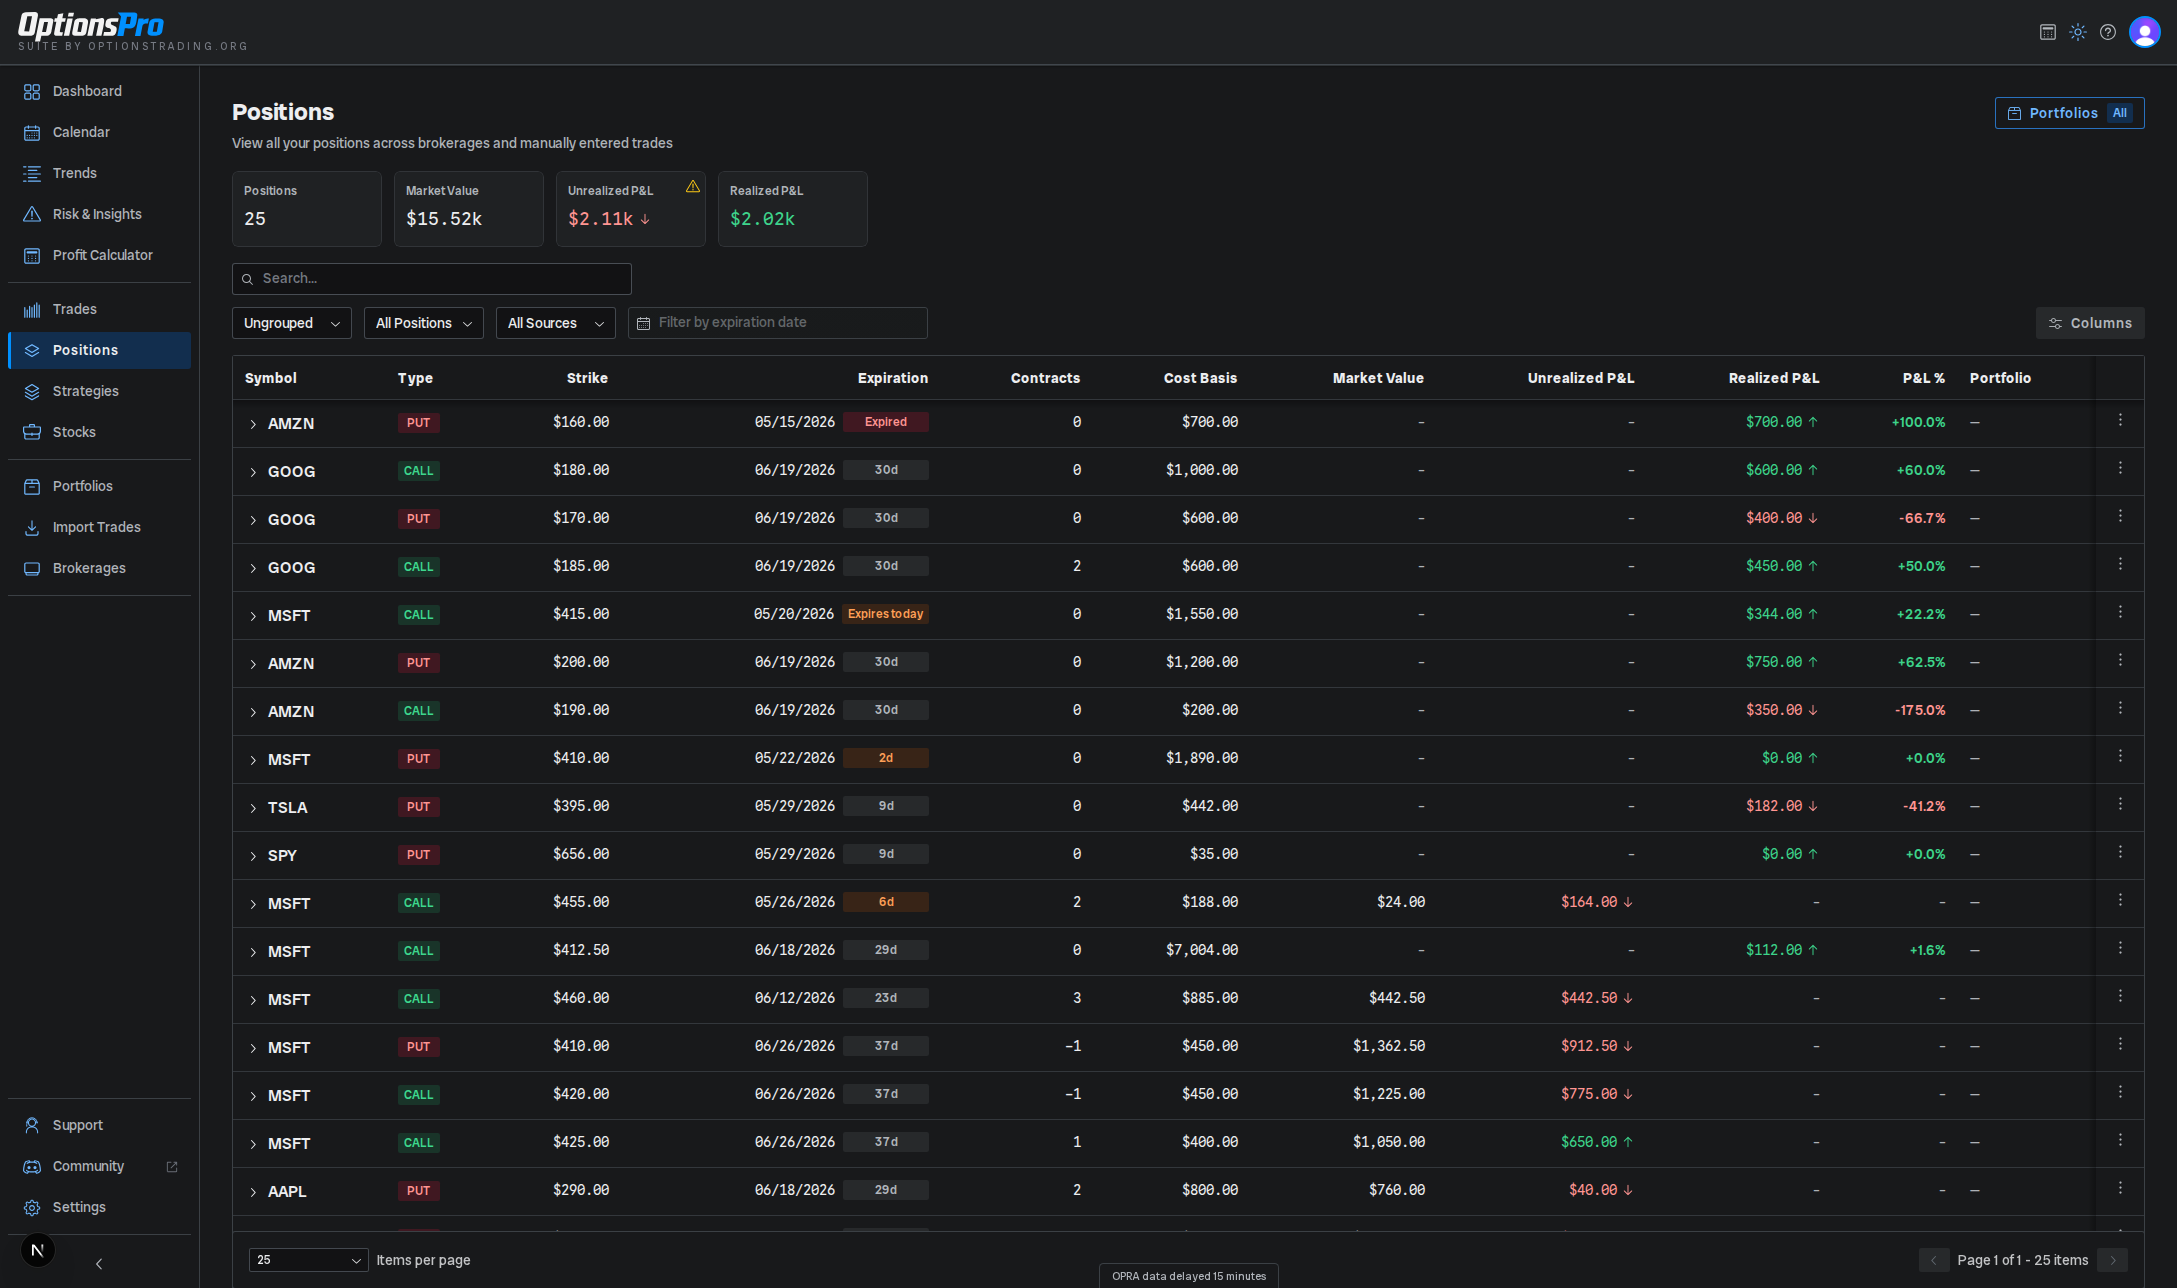
The Positions page is the live view of what you're holding right now. Each row is a single contract - symbol, type, strike, and expiration - with quantity, cost basis, market value, and P&L.
Summary cards
Above the table, four cards roll up the currently filtered positions:
- Positions - count of positions matching the active filters.
- Market Value - sum of position market values.
- Unrealized P&L - total open P&L, with an up/down arrow and green/red color. While market data is still being fetched, a small "pending" indicator appears on the card.
- Realized P&L - total realized P&L from closing trades on these positions.
A portfolio filter sits in the page header to scope every card and the table to one or more portfolios.
Columns
In the default (Ungrouped) view, columns are:
- Symbol - underlying ticker.
- Type - call or put.
- Strike - option strike.
- Underlying - current stock price and day change.
- Expiration - expiration date with a colored badge: orange for expiring within 7 days, red for already expired, gray otherwise.
- Contracts - net contract count (positive for long, negative for short).
- Cost Basis - total premium paid or received for the open contracts.
- Market Value - current mark-to-market value of the position. Shows a dash while market data is still being fetched. In Group by Strategy view, an asterisk and orange tint additionally flag prices that may be delayed.
- Unrealized P&L - open P&L for the position, accounting for long vs short direction. Shows a dash for closed positions.
- Realized P&L - realized P&L from closing trades on this position.
- Portfolio - portfolio assignment, if any.
- Collateral (if enabled for your org) - cash required to secure a short put. A short put standing alone is treated as cash-secured; a short put with a protective long put in the same account is netted against it first, so defined-risk spreads show the smaller spread-width collateral instead of the full cash-secured amount.
In Group by Strategy view (Pro), the symbol column becomes Symbol / Strategy and each detected multi-leg strategy collapses into a single row with a leg-count badge that expands to show its legs. See Strategies for how detection works.
Selecting a strategy row selects every position beneath it. Its checkbox reflects the selection state of those positions, and the selection bar always reports the number of positions selected. With positions from a single underlying selected, the selection bar offers Group into Strategy - see Custom Strategy Grouping.
You can show, hide, or reorder columns from the table's column-customization menu.
Filters
Above the table:
- View Mode - Ungrouped or Group by Strategy (Pro).
- Status - All Positions, Open, Expired, or Closed.
- All Sources - filter by broker, or pick Manual to show only manually-entered positions. Hidden when only one source is connected.
- All Accounts - filter by a specific brokerage account. Only shown when a broker is selected with multiple accounts.
- Filter by expiration date - date range applied to expiration date.
- Search - free-text filter on the table (matches ticker and other visible fields).
Row actions
Open the actions menu at the end of a row for:
-
Analyze in Calculator - open the Profit Calculator with this position's legs pre-loaded. If the calculator is already at the 6-leg maximum, you'll be asked to clear and reload.
-
Close Position - only available for manual positions (positions whose contracts came from manually-entered trades). For broker-imported positions, close the position at your broker; OptionsPro will pick up the closing trade on the next sync.
-
Repair - opens the Rolling Repair Assistant, which analyzes the position and returns scored roll suggestions (Roll Out, Roll Up, Roll Down, Roll Out & Up, Roll Out & Down, Roll In, Roll In & Up, Roll In & Down) with target strike/expiration, net credit/debit, and Greeks before and after. It's informational only - you still record the roll as a close and a new opening trade. Hidden for closed or expired positions, and whenever there are no roll suggestions to show.
-
Add to Existing Strategy (Pro) - move this position into a strategy you already have on the same underlying. See Custom Strategy Grouping.
-
Share - build a shareable image card for the position: contract, net contracts, and P&L (plus average open/close prices and an expiry outcome label once it's closed). Only present when sharing is enabled for your organization - see Sharing.
In Group by Strategy view, strategy rows have their own menu with Analyze in Calculator (loads all legs), Share (a strategy card covering every leg), Break up (Pro - splits the strategy into simpler ones) and, for all-manual strategies, Close All Positions.
Position details
Click a row in the Positions table to expand it inline and reveal the position's market context. The same view opens as a modal when you click a position from the Calendar or Trades pages. It shows:
- Status badges - option type, market state (Market Open, Pre-Market, After Hours, or Market Closed), moneyness (ITM, ATM, or OTM), and days to expiry.
- Underlying - current stock price, day change, and day change %.
- Greeks - Delta (Δ), Gamma (Γ), Theta (Θ), and Vega (ν). Shown as a dash for expired positions or while market data is still loading.
- Volume & Interest - implied volatility, volume, and open interest.
- Position Metrics - position market value, notional delta, daily theta decay, and days to expiry (or contract count, in the modal).
- Entry Greeks (if enabled for your org) - the Greeks captured at the time each opening fill was recorded, shown per fill.
- Account Details - brokerage and account name, where applicable.
A timestamp at the bottom shows when market data was last fetched, with an orange note if prices are from a previous trading day. Quotes are fetched and cached rather than streamed, so they lag the live market - see Market Data for how far behind they run and why a mark is sometimes missing entirely.