Stocks
Your stock holdings across brokerages and manual entries, with average cost, market value, and unrealized P&L.
The Stocks page is the live view of every share position you currently hold. Each row aggregates a single underlying ticker - combining lots from manual entries and connected brokerage accounts - and shows quantity, weighted average cost, current price, market value, and unrealized P&L.
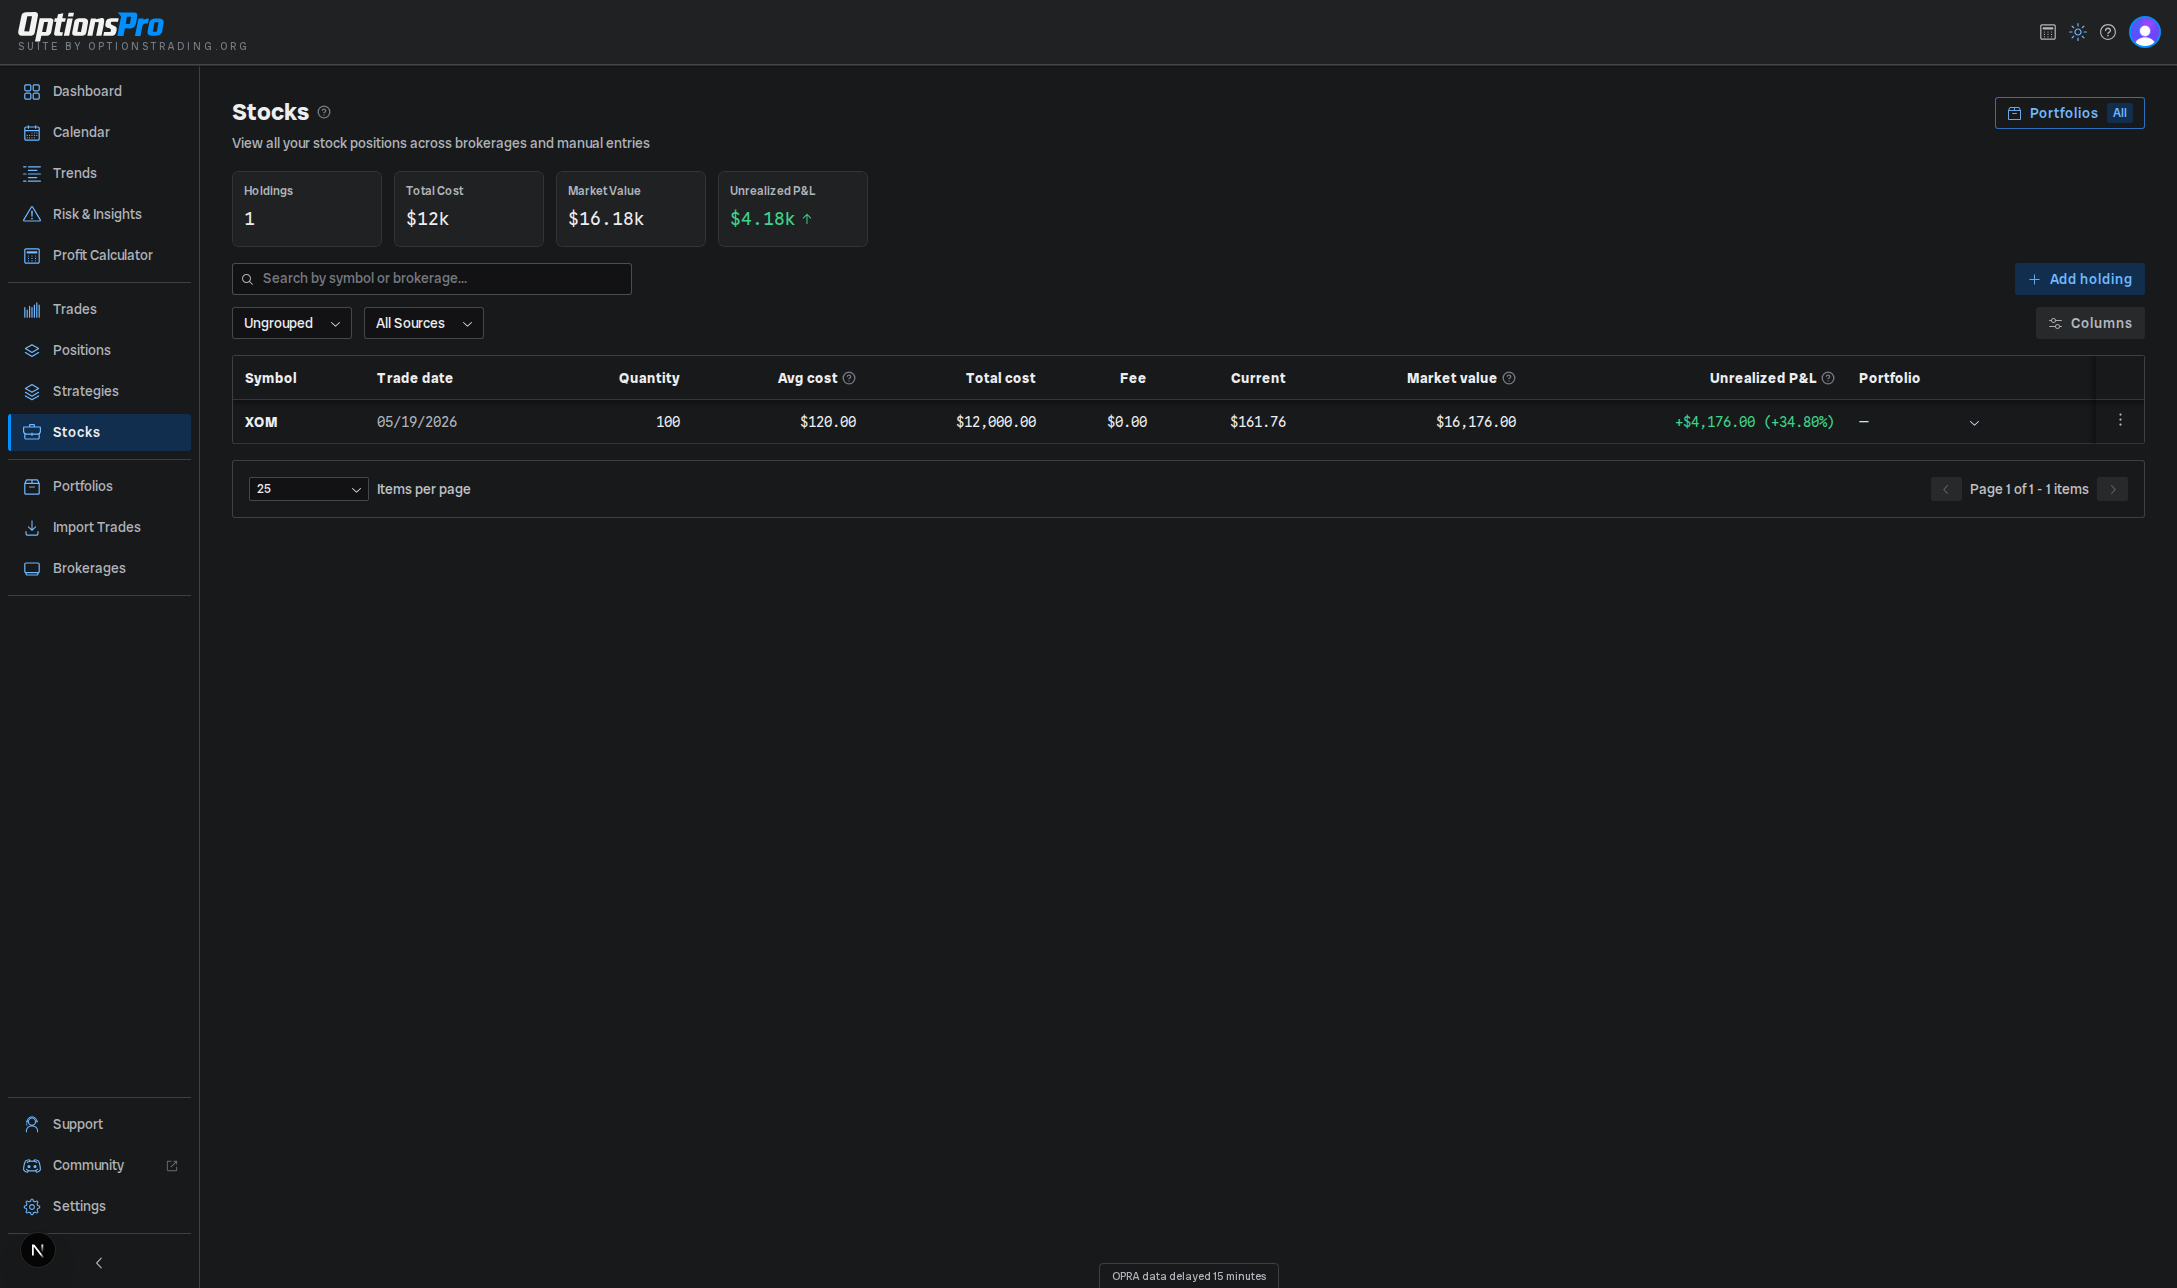
Summary cards
Above the table, four cards roll up the currently filtered holdings:
- Holdings - count of symbol-and-source groups matching the active filters. A symbol held both manually and at a brokerage, or at two different brokerages, counts as more than one holding.
- Total Cost - sum of cost basis across every visible holding.
- Market Value - current mark-to-market value of all holdings. Shows a dash if live market data is still being fetched.
- Unrealized P&L - total open P&L across visible holdings, with an up/down arrow and green/red color.
A portfolio filter sits in the page header to scope every card and the table to one or more portfolios.
Columns
In the default (Ungrouped) view, columns are:
- Symbol - underlying ticker. Click the row to expand and see the per-account breakdown when a symbol is held in multiple accounts. Rows are grouped by brokerage internally, so the same symbol held both manually and at a brokerage (or at two different brokerages) appears as separate rows - there's no separate "Brokerage" column, but you can filter or sort by source (see Filters below).
- Trade date - date of the earliest contributing lot.
- Quantity - total shares held across all lots for this symbol.
- Avg cost - weighted average cost per share, calculated across every buy/sell that contributed to the current holding.
- Total cost - total dollars invested in this holding (quantity × average cost).
- Fee - total fees across the contributing lots.
- Current - current per-share market price. Shows a dash while market data is still loading. For a holding synced from a brokerage this is your broker's own reported price, refreshed on the brokerage sync cadence, falling back to our market data provider's quote when the broker doesn't report one; manual holdings always use the provider quote. Either way it lags the live market - see Market Data.
- Market value - quantity × current price.
- Unrealized P&L - open P&L for the holding, with the percent return in parentheses. Shows a dash for holdings without market data.
- Adjusted basis (if enabled for your org) - per-share cost after netting the option premium you've realized on the ticker against what the shares cost. The number to weigh against your next covered-call strike, and not a tax figure. Shows a dash for symbols with no option history. See Wheel Cost Basis.
- Portfolio - portfolio assignment, if any (editable inline).
In Group by Portfolio view, rows are grouped under each portfolio with a portfolio-level total row and your unassigned holdings collected under an Unassigned group.
You can show, hide, or reorder columns from the table's column-customization menu.
Filters
Above the table:
- View Mode - Ungrouped or Group by Portfolio.
- All Sources - filter by broker, or pick Manual to show only manually-entered holdings. Hidden when there's only a single source.
- All Accounts - filter by a specific brokerage account. Only shown when a broker is selected with multiple accounts.
- Search - free-text filter on the table (matches the ticker).
Row actions
Click a row to expand it inline and view a per-account breakdown when the same symbol is held across multiple accounts. Each subrow shows the account name plus the quantity, average cost, total cost, current price, market value, and unrealized P&L for that account's portion.
If the symbol has option history and wheel cost basis is enabled for your organization, the expansion also carries a panel showing where the shares were assigned from, the premium ledger behind the adjusted basis, and how far the current price sits above or below it - see Wheel Cost Basis.
For manually-entered holdings, the row actions menu lets you:
- Edit holding - open the edit modal to adjust quantity, average cost, or trade date.
- Delete holding - remove the holding entirely. Broker-imported holdings cannot be edited or deleted; correct those at your broker and the next sync will reconcile.
Header buttons
- Add holding - open the manual-entry flow for a new stock holding.
Notes on average cost
The Avg cost column is weighted across every buy that contributes to the current holding, with sells reducing the quantity but not the average cost (a FIFO/weighted-average hybrid). If you've sold part of a position, the displayed cost reflects only the remaining shares. Holdings imported from a brokerage use the broker's reported cost basis when available.
That figure describes what you paid for the shares and nothing else. If the shares came from an assigned put and you've been writing calls against them, Wheel Cost Basis is the number that also accounts for the premium.