Dashboard
The dashboard is your trading command center - realized and unrealized P&L, win rate, equity curve, and the latest trades all on one page.
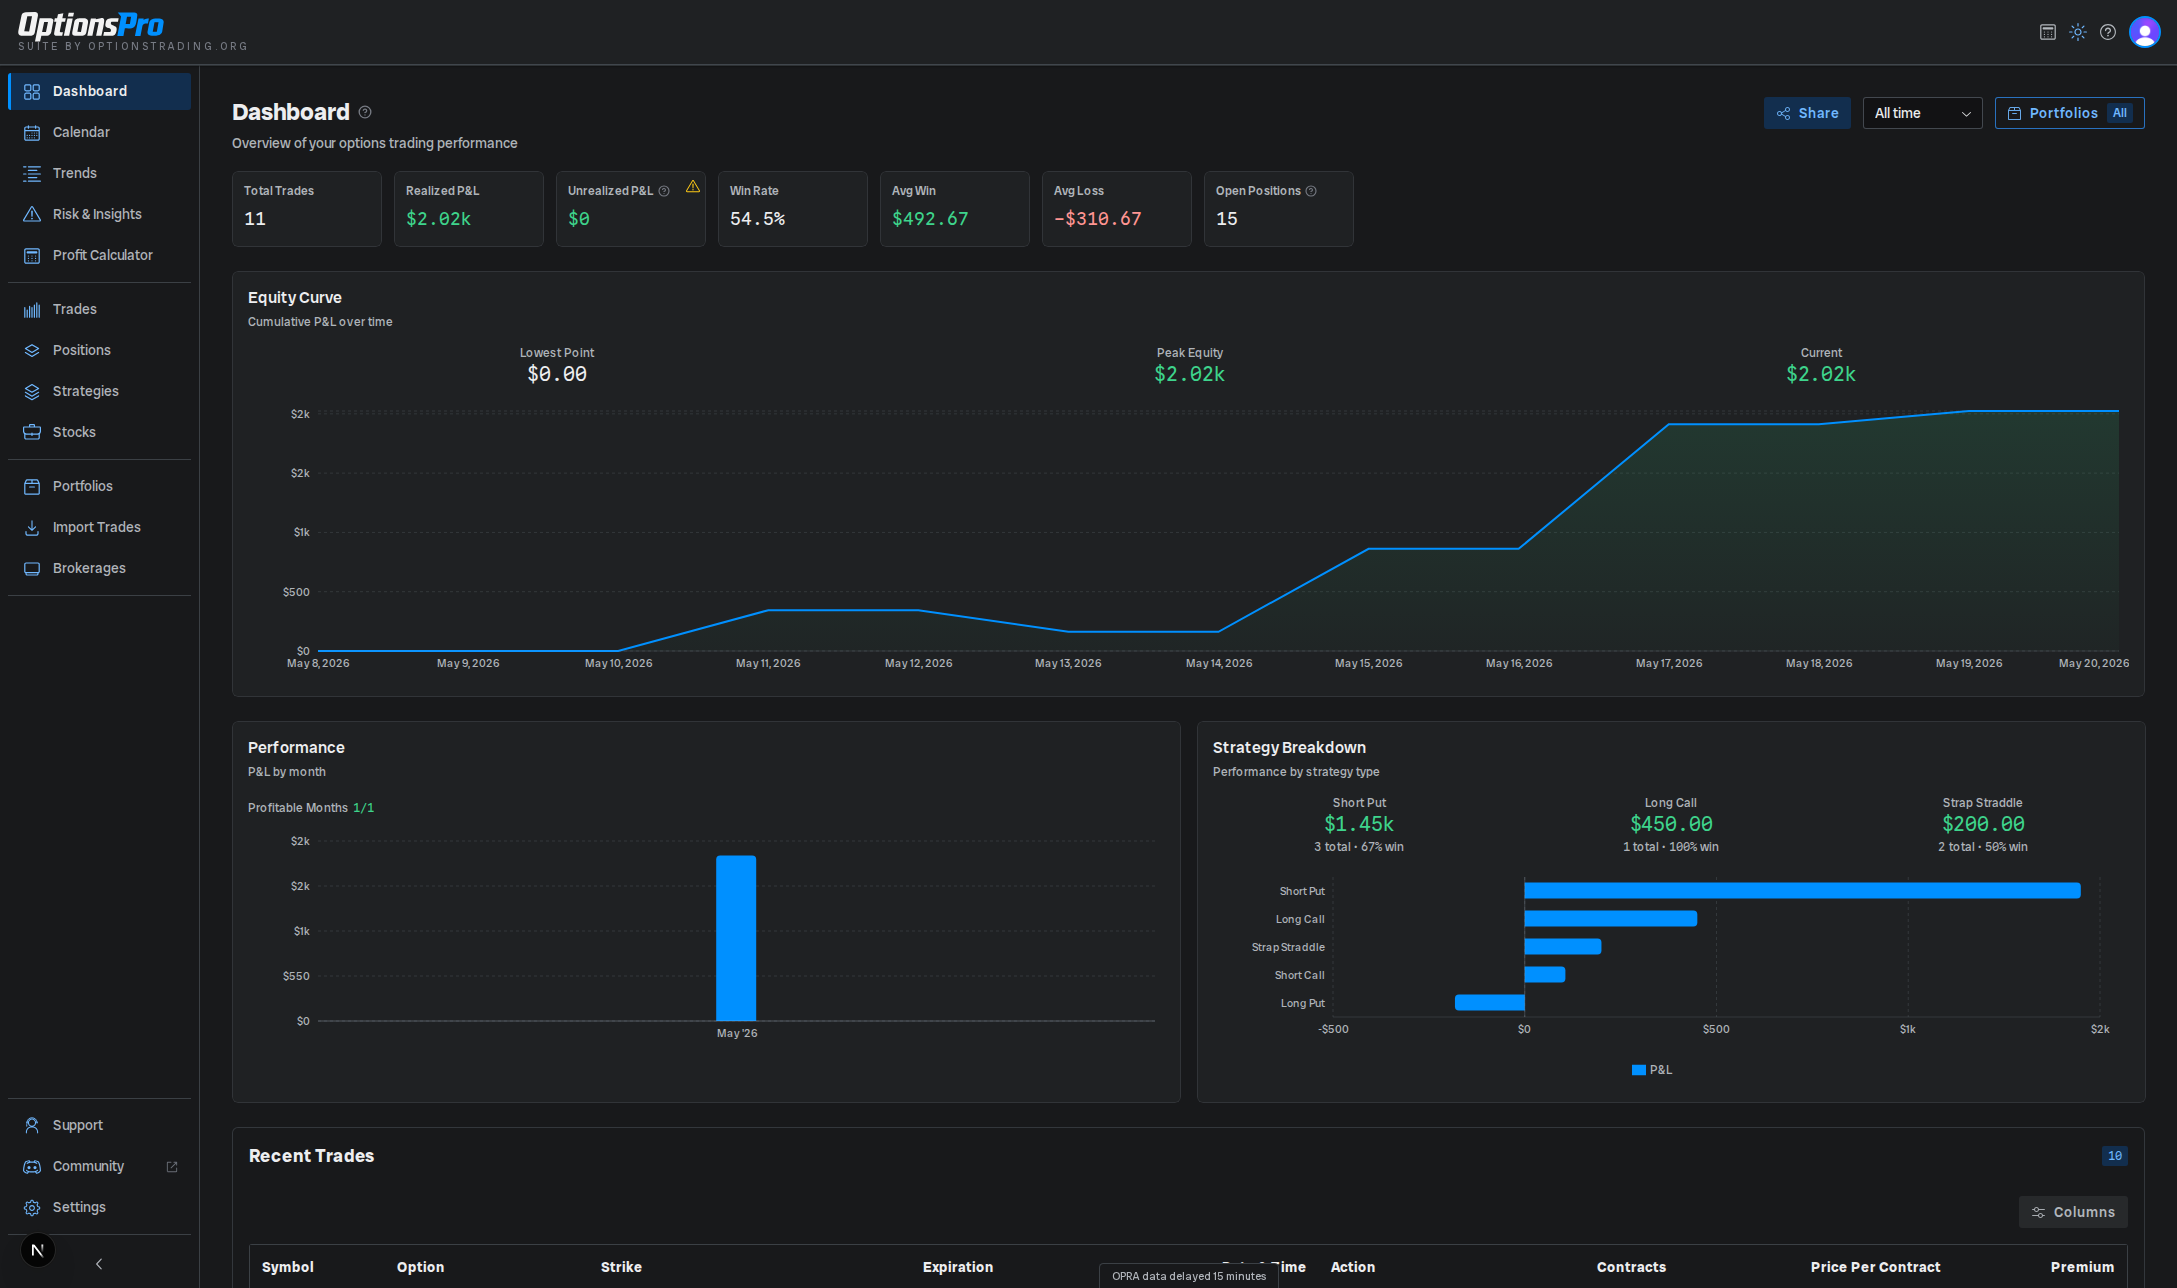
The dashboard answers one question fast: how am I doing? It aggregates every synced trade into a row of headline stat cards and a set of charts, filtered by the date range you pick at the top.
If OptionsPro can't fully reconcile one or more open positions with your broker's reported history, a banner appears just below the page header flagging that some P&L may be incomplete, with a link to Brokerages to see what's affected.
Filters
- Date range - All time (the default), Last 7 / 30 / 90 days, This month, or Last month. Affects most stat cards and every chart.
- Portfolio filter - restrict the view to a single portfolio (Pro). On the free tier it's always shown as an upgrade prompt, regardless of whether you have portfolios. On Pro it's hidden only if you have no portfolios at all.
A couple of cards (Unrealized P&L, Open Positions) reflect current state and are intentionally not affected by the date range.
Stat cards
The dashboard shows seven stat cards across the page header:
| Card | What it shows |
|---|---|
| Total Trades | Number of trades closed in the selected period (open trades aren't counted here). |
| Realized P&L | Closed-trade profit for the selected period. Green when positive, red when negative. A pulsing amber dot next to the value means a background job is still enriching recently closed trades - hover for details. |
| Unrealized P&L | Current paper P&L on open positions. Not affected by the date range. A small amber warning icon means option mark prices for one or more positions haven't arrived yet. Marks are delayed rather than live - see Market Data. |
| Win Rate | Percentage of closed trades in the period whose realized P&L was greater than zero. |
| Avg Win | Mean dollar outcome across the winning closed trades in the period. |
| Avg Loss | Mean dollar outcome across the losing closed trades in the period (shown as a negative number). |
| Open Positions | Count of currently-open positions. Not affected by the date range. |
Charts
Equity curve
A time-series of cumulative realized P&L over the selected range. The curve resets to zero at the start of the range, so a 30-day view and a 90-day view tell different stories intentionally. The chart header surfaces three running totals for the range: Lowest Point, Peak Equity, and Current.
Performance
A bar chart of realized P&L grouped by month, with a Profitable Months
ratio (e.g. 4/6) in the header. Useful for seeing seasonality in your
returns.
Strategy breakdown
A horizontal bar chart of P&L by detected strategy - vertical spreads, iron condors, long puts, and so on. The header highlights the top three strategies by P&L, each with its trade count and win rate. See Strategies for how detection works.
Recent Trades
The Recent Trades table sits below the charts and lists the ten most recent trade executions matching the active filters, newest first. Each row shows the trade date, symbol, type (e.g. Buy to Open, Sell to Close), strike and expiration for option trades, quantity, price, and amount. Columns can be shown or hidden from the table's column picker. The table is otherwise read-only here - to filter, sort, or edit, jump to the Trades page.
If sharing is enabled for your organization, a Share button in the page header generates a shareable performance card summarizing trade count, P&L, win rate, avg win, avg loss, and the equity curve for the selected date range. See Sharing.