Risk & Insights
Portfolio-level risk indicators, win/loss & streak analysis, Greeks, and the embedded AI assistant.
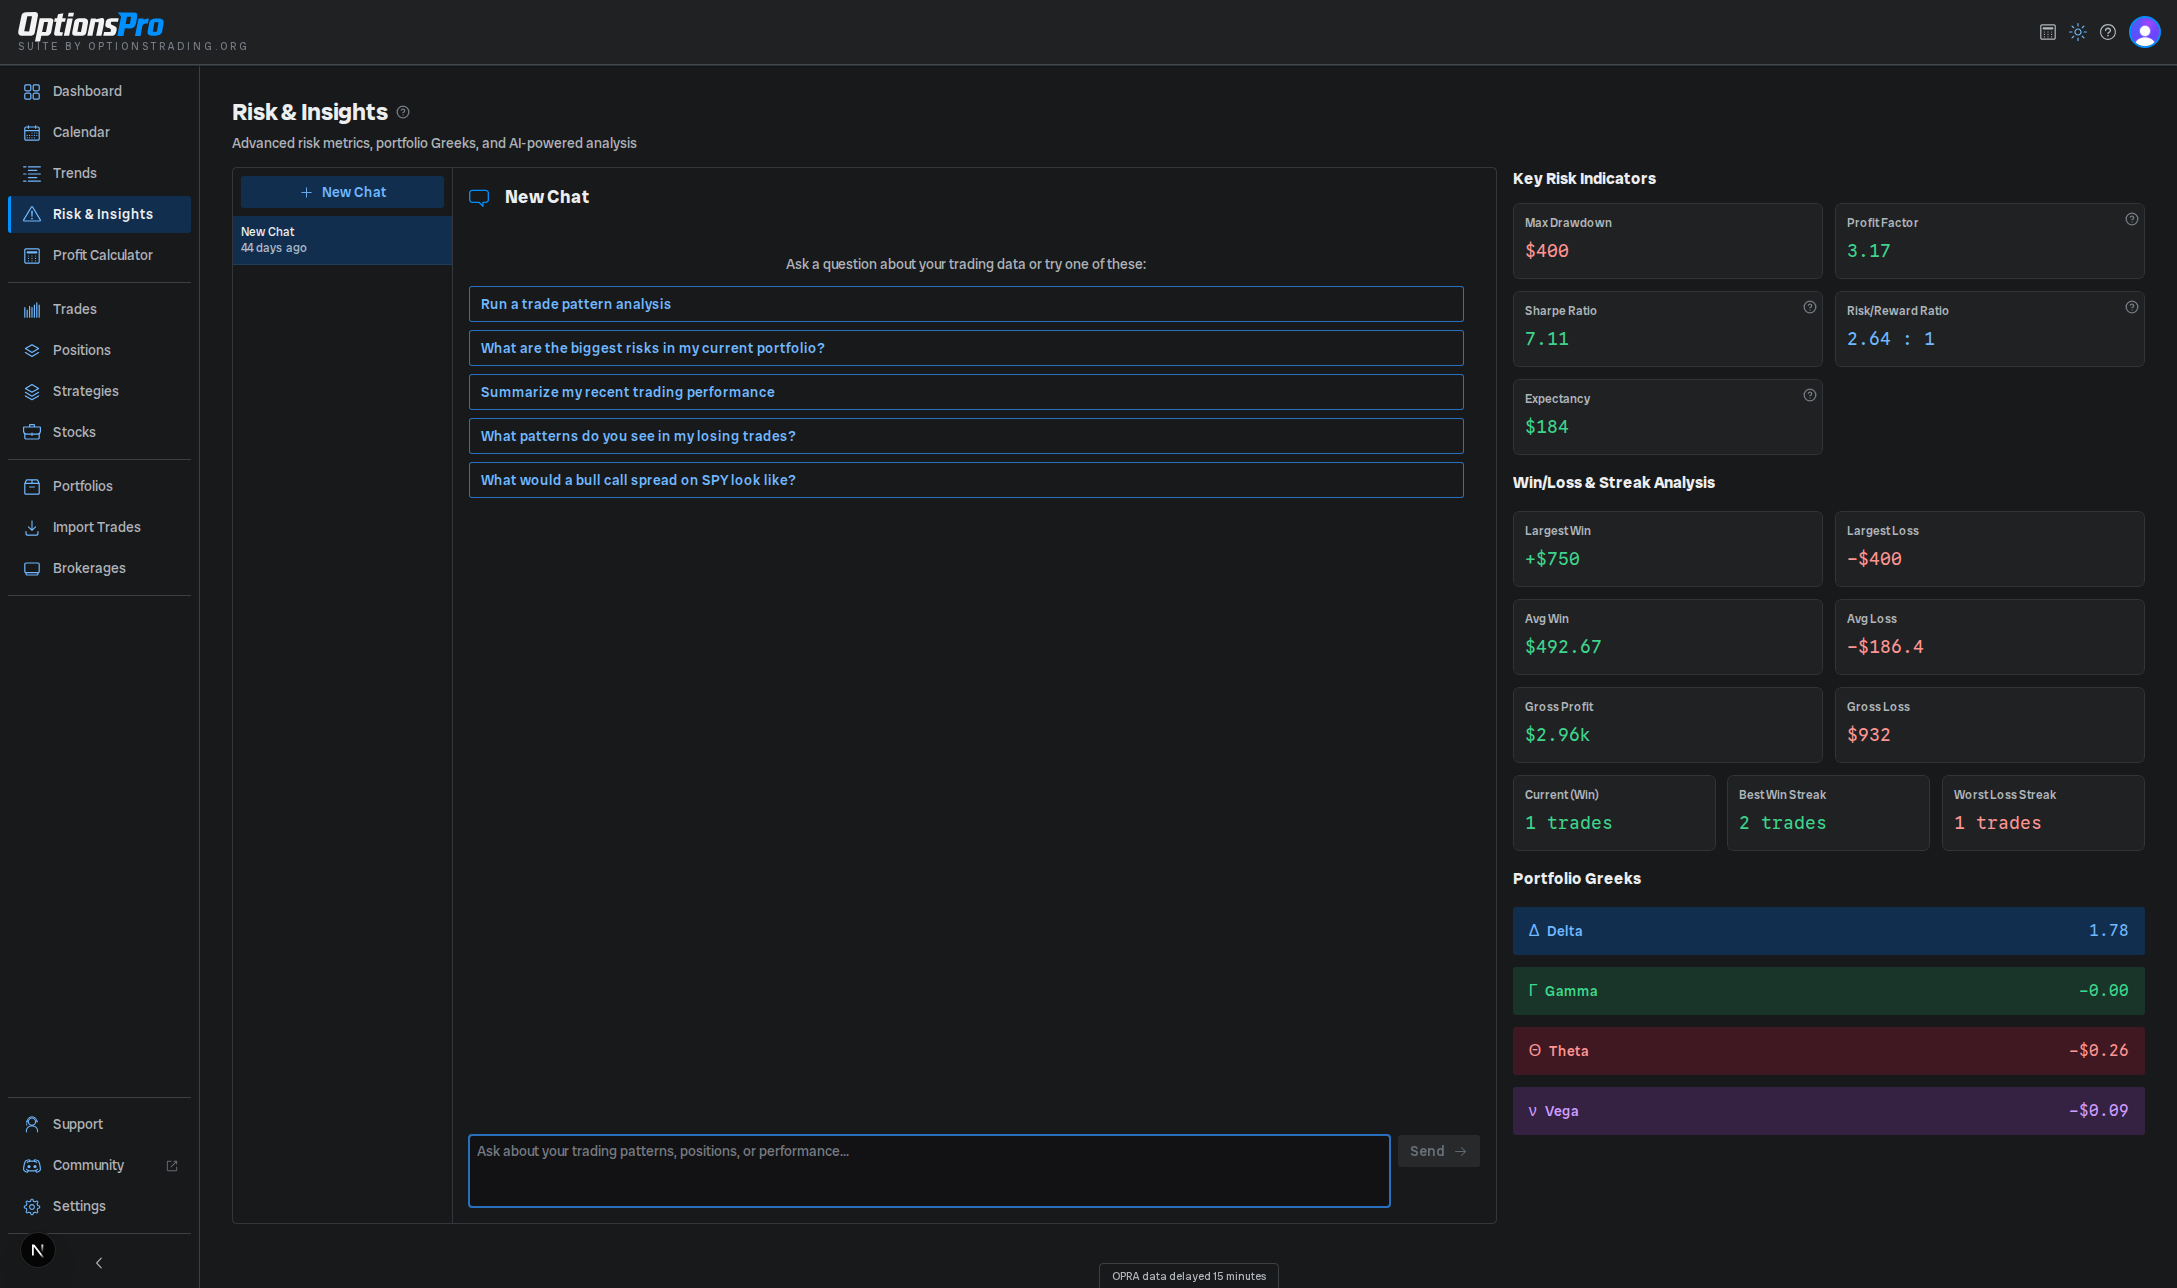
Risk & Insights is the analytics layer over your trades and positions. On wide screens it splits the page into two columns: the AI assistant on the left, and the metrics stack on the right. On narrower screens both collapse into mobile tabs.
Risk & Insights is a Pro-tier feature. See Subscription for plan details.
Sections
- Key Risk Indicators - Max Drawdown, Profit Factor, Sharpe Ratio, Risk/Reward Ratio, Expectancy. Profit Factor, Sharpe Ratio, Risk/Reward Ratio, and Expectancy each have a small "?" badge that opens an interpretation guide explaining what value ranges count as Excellent / Good / Average / Poor. Profit Factor's card itself is also color-coded by that scale.
- Win/Loss & Streak Analysis - Largest Win and Loss, Avg Win and Loss, Gross Profit and Loss, plus current streak (with Win/Loss label), best win streak, and worst loss streak.
- Portfolio Greeks - Delta, Gamma, Theta, Vega rolled up across open legs. See Greeks.
- AI assistant - a chat panel that can read your data and, with your approval, perform a small set of write actions. See AI Insights.
The legacy /risk and /ai-insights URLs both redirect here.
How often does it update?
Indicators recompute from your saved trades on each load and respect the active portfolio filter in the top bar - switching portfolios re-runs the metrics for that subset. Greeks refresh as position market data lands. A spinner next to the Portfolio Greeks heading indicates positions still being enriched in the background; badges next to it surface counts of positions with stale market data or invalid symbols.